Before you install Service Pack 6, you should be aware of a few things.
1) They corrected something that has to do with Context operators.
Especially if you're filtering on a field that has Context operators in it, your filter isn't going to work anymore.
Example = [Hire Date] = Max([Hire Date]) in([Person ID]) used to be the way it worked prior to this ServicePack. Now, this needs to be corrected to:
= [Hire Date] = Max([Hire Date]in([Person ID])) in([Person ID])
The way that function works, actually should make it clear that it used to be bugged before -- but the result can be quite annoying -- the bug is corrected -- very good, but now some of your reports will not return correct data or return no data at all.
2) Variables can no longer have a name equal to one of the Data providers.
This might not seem a big thing, but it happens more than you'd think. One of the dataproviders is called employee.. and you accidently make a variable called employee. With SP6, this report won't even display anymore.
The solution we found is to open the report in an older version Rich Client, change the name of the dataprovider and publish the report.
But, Service Pack 6 does deliver some useful bugfixes. Java 1.7 works flawlessly and dates from excel no longer show up as 1/1/1970.
Cheers
Peter
dinsdag, september 17, 2013
dinsdag, mei 07, 2013
Recovering SQL from old DeskI reports
Imagine the following situation:
You have some old BusinessObjects documents. The Universe is no longer available, you can't edit the query anymore, but you would like to obtain the SQL that's at the basis of it.
If this is the situation you are in, then here is your solution.
Go to Tools>Macro>Visual basic editor and create a new function:
Function test()
a = Application.ActiveDocument.DataProviders(1).SQL
Set fso = CreateObject("scripting.filesystemobject")
Set file = fso.createtextfile("c:\temp\sqlcode1.txt")
file.writeline a
End Function
next, press the triangle icon to run the function and you have query 1.. if more than 1 query exists, simply choose dataprovider(2).. etc and write them to separate textfiles.
Short .. and sweet :)
Peter
dinsdag, april 02, 2013
Publication workaround (Business Objects)
Due to a bug in Business Objects XI R3, you might occasionally get the following error when you try to publish a report:
"Invalid Report, please choose a different report."
Very annoying when that happens, and the only solution that I know of is a restart of the server. But there is a simple and effective workaround:
While building your publication, you have to specify a Webi or DeskI document that will serve as a distribution list for your publication.
On the SAP website, you 'll find that you have to set a restriction on that distribution document. You have to limit the number of rows returned in the query (options).
That didn't work for me, but it might work for you.
My workaround? Use a DESKI report as distribution map. The document you'll be sending around can be a WEBI document of course, but the document you use to split it, can be DeskI and you won't be getting that annoying error.
Good luck folks
Peter
zondag, maart 10, 2013
The latest version of a Report (Business Objects)
Let's assume, you have this Dashboard. It runs every night and in the morning, when you open your browser, you want to see it pop up on your screen by default.
The issue you might run into, is that the Dashboard you scheduled, if you simply point to the report, you don't get the latest version, you get your original. Here's how you get around that:
First, you build your dashboard of course and you schedule it.
Go to Preferences and choose to view reports in an extra window:

Once the report ran at least once, you click right on the report.
From the menu, you should see


Cool huh :)
Enjoy,
Peter
The issue you might run into, is that the Dashboard you scheduled, if you simply point to the report, you don't get the latest version, you get your original. Here's how you get around that:
First, you build your dashboard of course and you schedule it.
Go to Preferences and choose to view reports in an extra window:
Once the report ran at least once, you click right on the report.
From the menu, you should see

From the menu, pick : View latest instance.
The latest instance of the report should now open in a new window.
When the report is open, press (Function key) F11. This should put the report in Full-screen. Now, when you move the mouse over the top part of the screen, it should be possible to see the URL of the Report. Select that URL and press Ctrl-C (copy).
Next, From the New menu, we create a new InfoView Page Layout.
Click: Define content
The dialog box that now appears has a box that says: Web Address.

Paste the URL in the Web-address box.
The fun part of the trick I showed you (F11) is that that specific URL will ALWAYS give you the most recent version of the report.
Cool huh :)
Enjoy,
Peter
zondag, februari 10, 2013
Ranking without duplicates in Business Objects
Here's a trick I got from James on the BOB-forum -- to a question from one of the visitors. Personally, I found the question a bit dodgy, but James worked out a nice two-step to get around the problem:
Lets asume we wanted to have a Top 10. But we wanted to disregard any duplicate values.
I'll get us a list of data to illustrate the idea:


Lets asume we wanted to have a Top 10. But we wanted to disregard any duplicate values.
I'll get us a list of data to illustrate the idea:
In the above list, a bunch of duplicates exist. K = 9, but L is also 9 (we want to lose L in our top 10), G is 6 but H is also 6, we want to lose H.. etc.
The first step is to create a ranking variable [Rank]:
=Rank([Value];[Code])

Great, now we want to find out what the rank is of the previous line:
=Previous([Rank])

Nice, so now, when Previous and Rank are the same, we want to lose the line. So we create a Flag-variable:
=if([Rank]=[Previous Rank];0;1)
Watch out though, don't insert the variable into your table or:

And if you get that error, you'll have to close the document and re-open it to get this to work.
Next, we apply a filter on the table:

Now, if we apply a top 5 on the table, it will only rank the unique values.

Works like a charm.
Thanks James,
Peter
woensdag, januari 30, 2013
The Tip Jar
Today, my wife asked me, how my Tip Jar was coming along. (The button you might have seen on the right)
I answered her truthfully:
I love you very much dear.
She said: So, how many people visit your blog these days?
I answered her truthfully:
About 2000 a month.
Wow, she replied, then that tip-jar idea I gave you must have really payed off right?
I answered truthfuly:
Not a penny dear.
Right, she replied, I'll cancel our holiday on the Bahama's then.
I agreed.
Can I write another article? I asked with a small voice.
Sure, she replied, are you going to leave the button on?
You never know, I responded. One day, a tip on this blog will be so helpful, a visitor will make a generous donation and we can have that holiday on the Bahama's.
I suppose one can dream, she replied-- a bit miffed.
I could bundle the blog and turn it into a book -- I suggested hopefully.
How are you going to turn the stuff you write about into an intriguing murder mystery that everyone wants to read? She asked jabbingly.
Hm.. I could change the name of my blog to "The Davinci code" I replied.
It's a start. She said, as she left the room.
Cheers folks,
Peter
I answered her truthfully:
I love you very much dear.
She said: So, how many people visit your blog these days?
I answered her truthfully:
About 2000 a month.
Wow, she replied, then that tip-jar idea I gave you must have really payed off right?
I answered truthfuly:
Not a penny dear.
Right, she replied, I'll cancel our holiday on the Bahama's then.
I agreed.
Can I write another article? I asked with a small voice.
Sure, she replied, are you going to leave the button on?
You never know, I responded. One day, a tip on this blog will be so helpful, a visitor will make a generous donation and we can have that holiday on the Bahama's.
I suppose one can dream, she replied-- a bit miffed.
I could bundle the blog and turn it into a book -- I suggested hopefully.
How are you going to turn the stuff you write about into an intriguing murder mystery that everyone wants to read? She asked jabbingly.
Hm.. I could change the name of my blog to "The Davinci code" I replied.
It's a start. She said, as she left the room.
Cheers folks,
Peter
zondag, januari 27, 2013
Compound Annual Growth rate in Business Objects
To calculate the Compound Annual Growth rate, Excel has a function called XIRR. BO doesn't have that, but that's easy to remedy. All you need to do, is work out the following formula:
 So, now we need a bunch of numbers and see where we get:
Right -- this has everything to do with investments, something I know nothing about, but here's some numbers to get us started :
On Jan 1 2010, we invest 10000€
On Jan 1 2011, our investment has grown to 13000€
On Jan 1 2012, our investment has grown to 15000€
and
finally, On Jan 1 2013, our investment has now a value of 19500€
The table looks like this in BO:

So, our formula for that division becomes :
=[Value] where ([Date]=Max([Date]) In Report) / [Value] where ([Date]=Min([Date]) In Report)
I'll call this one basefigure

And we divide 1 by that figure:
=1/(Year(Max([Date]) In Report) - Year(Min([Date]) In Report))
this one, I'll call exponent


Right -- this has everything to do with investments, something I know nothing about, but here's some numbers to get us started :
On Jan 1 2010, we invest 10000€
On Jan 1 2011, our investment has grown to 13000€
On Jan 1 2012, our investment has grown to 15000€
and
finally, On Jan 1 2013, our investment has now a value of 19500€
The table looks like this in BO:
First, we'll divide our ending value by our beginning value -- interesting challenge.
Our last date would be : =Max([Date]) In Report = 1/1/2013
Our first date would be : =Min([Date]) In Report = 1/1/2010
So, our formula for that division becomes :
=[Value] where ([Date]=Max([Date]) In Report) / [Value] where ([Date]=Min([Date]) In Report)
I'll call this one basefigure
Now, we need to find out how many years it took:
The formula for that one is rather easy :
=Year(Max([Date]) In Report) - Year(Min([Date]) In Report)
And we divide 1 by that figure:
=1/(Year(Max([Date]) In Report) - Year(Min([Date]) In Report))
this one, I'll call exponent
There. Now, the next step would be to raise our first figure to the power of that second figure and subtract 1.
=Power([Basefigure];[Exponent])-1
Our Compound Annual Growth rate would be : 0.25 -- I guess those figures occurred in a parallel universe :)
Cool
Cheers folks
Peter
A running balance in Business Objects
I think it's quite clear by now, that it is my objective, never ever to need Excel -- well, almost. The charts in Excel do exceed BO's, but math -- naaaah.
Our next venture, is calculating a running balance.
In a running balance, we have a series of deposits and a series of withdrawals and we want to
keep track of the total of our balance at all times.
Here's how:
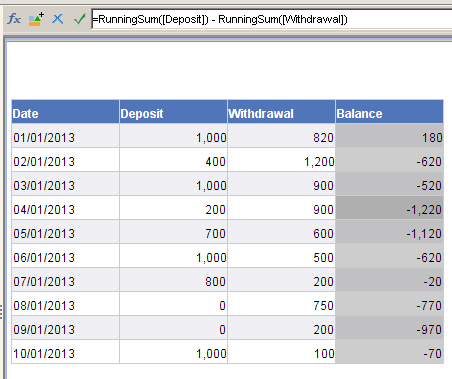
First, we need two columns. One has our deposits, the other has the withdrawals.

Now, we want to show a third column, with our balance -- on 1/1/2013, this should be : 180, on 2/1/2013, this should be -620 etc.
This is laughably easy really -- since BusinessObjects has a function Excel doesn't have: RunningSum
=runningsum([Deposit]) - runningsum([Withdrawal])
The result is :

Our next venture, is calculating a running balance.
In a running balance, we have a series of deposits and a series of withdrawals and we want to
keep track of the total of our balance at all times.
Here's how:
First, we need two columns. One has our deposits, the other has the withdrawals.

This is laughably easy really -- since BusinessObjects has a function Excel doesn't have: RunningSum
=runningsum([Deposit]) - runningsum([Withdrawal])
The result is :
In Excel this would be something like :
| A | B | C |
|---|---|---|
| Deposits | Withdrawals | Balance |
| $1,000 | $625 | =SUM(A2,-B2) |
| $1000 | 740 | =SUM(C2,A3,-B3) |
Looks like our balance is in the red -- but with the economic times, that seems right :)
Cheers folks
Peter
zondag, januari 20, 2013
Trimmed mean in Business Objects
This is a challenging one.
This is what the formula looks like:


=NoFilter(Rank([Sold at (unit price)];Top))
This gives us the Top -- returning a value -- if V_ProductsToKeep is higher or equal than that value, we filter the value out.
Same with the lowest:
=NoFilter(Rank([Sold at (unit price)];Bottom))
This gives us the Bottom -- returning a value -- if V_ProductsToKeep is lower or equal, we filter that value out.
=If([V_Bottom] <= [V_ProductsToKeep]) Then (0) ElseIf ([V_Top]<=[V_ProductsToKeep]) Then 0 Else 1

=Sum([Sold at (unit price)])Where([V_Evaluate]=1) / ([V_NProducts] - ([V_ProductsToKeep]*2))
There. Not easy at all, but it works.
Our Trimmed mean with k = 33% is 166.6 -- higher than our regular mean, because we dropped the bottom and top 33% of the values.
If we change k to 0.1, the trimmed mean is:165.8

This is what the formula looks like:

But all this means is:
You pick a value k. And the % k number of values, is dropped while calculating the mean.
So, if k = 10% and you have 100 values, you'll be dropping the bottom 10 and the top 10 values and calculate the mean on the remaining 80.
I think it will be useful, to use ranking to calculate these.
First, lets calculate, from our list of products, with k = 30%, how many values we would need to drop.

We have 12 values. 30% of 12 = 4, so we'll be dropping the top 4 and the bottom 4 values.
Let's calculate this in Business Objects.
V_k = 0.3
=round(count([Lines]) * V_k,0)
which I will name V_ProductsToKeep
We need an integer of course, so round it is.

So, now we need to find out, what the 4th highest value is and filter everything out that is higher or equal. And we need to find out what the 4th lowest value is and filter everything out that is lower or equal.
This gives us the Top -- returning a value -- if V_ProductsToKeep is higher or equal than that value, we filter the value out.
Same with the lowest:
=NoFilter(Rank([Sold at (unit price)];Bottom))
This gives us the Bottom -- returning a value -- if V_ProductsToKeep is lower or equal, we filter that value out.
=If([V_Bottom] <= [V_ProductsToKeep]) Then (0) ElseIf ([V_Top]<=[V_ProductsToKeep]) Then 0 Else 1

Nice, now all we need is a formula, that determines what the sum is of [Sold at (unit price] where V_Evaluate = 1
=Sum([Sold at (unit price)])Where([V_Evaluate]=1) / ([V_NProducts] - ([V_ProductsToKeep]*2))
There. Not easy at all, but it works.
Our Trimmed mean with k = 33% is 166.6 -- higher than our regular mean, because we dropped the bottom and top 33% of the values.
If we change k to 0.1, the trimmed mean is:165.8

Good fun -- not that easy to do. I think that's going to be it for averages for now :)
zaterdag, januari 19, 2013
Quadratic average in Business Objects
Next up: the Quadratic mean.
As usual, first the function:


From the looks of it, we first need a count of the number of entries and divide 1 by that number. In our case, this gives us the following formula:
=1/count([Lines])


As usual, first the function:

This is quite a different animal. The application of it isn't really sales, on wikipedia it even says that this applies to electricity, but I don't have those kind of figures -- it'll work just as good with my numbers. It no longer takes into account the number of items sold, so our starting table is going to look a bit different:

=1/count([Lines])

In our case, this is 1/12 or : 0.08.
Next, we have to take the second power of each unit price.. easy peasy.
=power([Sold at (unit price)];2)
And next, we need to add those up:
=Sum(Power([Sold at (unit price)];2))

Next, we have to multiply those and take the square-root.
=sqrt(Sum(Power([Sold at (unit price)];2))*(1/Count([Lines])))

The Quadratic mean of the unit price is 167 -- so far, that's the highest mean we got.
More averages coming up.
Peter
Weighted Harmonic Average in Business Objects
So, here's the second part of the Averages series. And this one might prove to be just a bit more challenging.
This time, we're going to calculate the Weighted Harmonic Average.
The formula I found on Wikipedia looks like this:


This time, we're going to calculate the Weighted Harmonic Average.
The formula I found on Wikipedia looks like this:

The table we're starting with, again, looks like this:

Our Average is 165.8, the median is 165.05 and the Weighted average is 163. Lets see what the Harmonic Weighted average gives us.
Lets add up our Unit Prices.
=sum([Quantity sold])

Now, we divide each quantity sold by the unit price and we add them up. Sounds weird to me, but, why not.
(Sum([Quantity sold]/[Sold at (unit price)])

I think I'm starting to like this particular average :)
Last step, we divide.
=Sum([Quantity sold]) / (Sum([Quantity sold]/[Sold at (unit price)]))

Tada, our Weighted Harmonic Average : 161.52
More averages to come :)
Peter
Calculating averages in Business Objects
Time for some averages.
Obviously, I'm not going to deal with the average function, that seems straightforward enough. This article and following articles will be about some other averages:
Weighted mean, Weighted harmonic mean, Quadratic mean, Winsor mean, Truncated mean, Mean of Angles, and so on and so forth. I didn't know there were that many means, so it's gonna be fun figuring some of them out. As I already pointed out in previous articles, I'm not a mathematician, so I'm learning this stuff as I write it.
Let's start with the Weighted mean.
The formula on Wikipedia looks like this:
Fortuntately, I had the chance of learning to read these syntaxes when I wrote the articles on trendlines. So, it's going to be just a little bit easier.
Basically, it's just going to be adding up a bunch of multiplications and dividing it again. Lets get a bunch of numbers:
Our starting table is this one -- as usual, I'm taking eFashion to start from:

We're interested in the weighted average of the Unit Price. The average is 165.80 and the median would be:165.05.
First, we multiply Quantity sold and unit price and we add them up.
In a column to the right, I'm adding =[Quantity sold]*[Sold at (unit price)]

Nice. Next, we divide that big number by the total of the quantities:
=sum([Quantity sold]*[Sold at (unit price)])/sum([Quantity sold])
This results in:

Our weighted mean is: 163
More means coming up.
Peter
dinsdag, januari 15, 2013
ForceMerge
Quite a useful function I should say. I think it just might be the solution to much of the Multivalue errors I've been having in my job as a Reporting Officer.
Here's how ForceMerge works :
First, you make two queries. One contains the dimension you don't have in your second universe and a common field,the other one contains that common field and some calculated data.


Here's how ForceMerge works :
First, you make two queries. One contains the dimension you don't have in your second universe and a common field,the other one contains that common field and some calculated data.

The left table contains states and cities, the right one contains cities and Sales figures. What we would really want, is State and Sales figures.
So, we move the sales figures in with the left table ( first we merge the city object of course).

There.. looking great. Just, we don't want the city. we want the state. But when we remove it:
We get ourselves a cartesian product. The solution to this issue is: Forcemerge().
When we change the formula for the Sales figures to : =ForceMerge([Sales Revenue]), the following table emerges:

Ain't that a beauty :)
That's all folks.
Enjoy,
Peter
zaterdag, januari 12, 2013
business objects operator "????"
I noticed that someone searched for these terms.
This is probably going to be short and sweet:
business objects operator "????"
Whenever you find ???? inside a variable, it simply means that the object that was used
to create this particular variable, is no longer in the query.
Let's say that you create a variable Year. And you use the following formula:
=year([Sales date])
and then, remove the object [Sales date] from your query.
The object Year will then contain =year(????)
Not good :)
Cheers
maandag, december 24, 2012
Bubbeling data
Here's an interesting problem I ran into last week:
Date Code Emplid Name of the Employee
2012/12/01 -- DTA -- 123 -- John
2010/12/10 -- XFR -- 123 -- John
2012/12/05 -- DTA -- 456 -- Bert
2012/05/08 -- DTA -- 567 -- Pascal
2000/06/04 -- DTA -- 567 -- Pascal
2000/05/01 -- XFR -- 567 -- Pascal
Right. My boss asked me, in the above list, to show him the transfers for people that got transferred, and for everyone else, he needed their most recent situation.
The tricky part is : you can't filter on a code and you can't filter on a date.
Part of the solution is of course to be found in the article where I showed you how to get the two most recent items. That is, we're going to turn our date into a number :
=(year([Date])*10000)+(monthnumberinyear([Date])*100) + daynumberinmonth([Date])
First, we need to create a break on Emplid of course.
CalcDate Date Code Emplid Name of the Employee
20121201 -- 2012/12/01 -- DTA -- 123 -- John
20101210 -- 2010/12/10 -- XFR -- 123 -- John
20121205 -- 2012/12/05 -- DTA -- 456 -- Bert
20120508 -- 2012/05/08 -- DTA -- 567 -- Pascal
20000604 -- 2000/06/04 -- DTA -- 567 -- Pascal
20000501 -- 2000/05/01 -- XFR -- 567 -- Pascal
And then, we can create a rank on CalcDate and get our most recent items. Easy. BUT. There was an additional requirement. If the employee had a transfer, we need that person's most recent transfer.
Easy as pie :
=CalcDate * if([Code]="XFR") then (1000) else (1)
Of course, this messes up the date-look of Calcdate a bit, but it gets the job done. When you rank on it, you get :
CalcDate Date Code Emplid Name of the Employee
20101210000 -- 2010/12/10 -- XFR -- 123 -- John
20121205 -- 2012/12/05 -- DTA -- 456 -- Bert
20000501000 -- 2000/05/01 -- XFR -- 567 -- Pascal
Mission accomplished :)
Cheers
Peter
woensdag, december 19, 2012
Forecast formula in Business Objects
I noticed someone searching for the following : target sales revenue formula
Obviously, it's rather simplistic, but here's a formula to try calculate a future number, when you already have some numbers from the past.
Let's say we had numbers for 4 quarters and 2 years.
2010 Q1 1000
2010 Q2 500
2010 Q3 900
2010 Q4 800
2011 Q1 1250
2011 Q2 800
2011 Q3 800
2011 Q4 700
and we want to figure out, if that trend continues, what the numbers for 2012 will look like. Here's how:
=(sum([Sales] where ([Year]="2010")) * 0.25) +(sum([Sales] where ([Year]="2011")) * 0.75)
For Q1 2012, this would give : 250 + 937.5 = 1187.5
Of course, you could add a fraction, based on your own business knowledge, but it's a start.
zaterdag, december 15, 2012
Random selection of 300 in Business Objects
Now that was cool.
My boss said. I need you to make me a Business Objects Query. The KUL University asked us to provide a random selection of employees.
They need the selection to have the right percentage of Age groups in it.
The group should have the right amount of Men and Women in it
It should represent our departments and job functions proportionately.
You'll probably need two days to set this up.
I don't know much about statistics, but I do know that a random selection of 300 out of 9000, if the selection is truly random, I don't have to bother with the rest of that stuff, the groups will be properly represented.
So, I went ahead and made a query that gave me the Company's population.
9000 people
47% Women
53% Men
Then, I applied the following little trick -- and this is the purpose of this very article:
In Business Objects Query panel, I chose to write custom SQL and I then put this little piece of code there: at the very bottom of the SQL.
ORDER BY dbms_random.value (only for Oracle)
This will randomize the list.
Next, in the query's options, I set the option to only return 300 results.
15 minutes after my boss told me to start doing a 2-day job, I finished it.
Of course, I made the same percentage calculations and obviously, they returned the same results as the master list.
If you need to do this in other DBMS systems, the code is:
MySQL:
ORDER BY RAND()
LIMIT 1
Microsoft SQL:
ORDER BY NEWID()
Enjoy
woensdag, oktober 10, 2012
The Activity Universe
Some of the most common questions people ask themselves, can be solved quite easily, by using the Auditing universe by Business Objects themselves.
How long does a report take on average to refresh?
In which reports do we use a certain objects?
Maybe, when a report fails to refresh, you want to know about it?
Maybe, when a report runs a LOT faster than usual, you want to know about it?(because chances are, the report will be empty then)
That's when you use the Activity Universe.
...
The Activity Universe exists in every Business Objects Environment, but you need to have auditing switched on. Many environments do have this.
Ask about it to your local Business Objects Administrator :)
Peter
maandag, september 03, 2012
The versions of Business Objects
Like me, you probably get a teeny tiny bit confused with the various versions of Business Objects.
So, let's list them :
When I first ran into Business Objects, it was at version 5. That was back in 2003, but version 5 had been around for quite a while by then.
Version DeskI WebI
5.0 Yes (5.0) Yes (2.7 and 2.8)
Then, some time later, I had my first encounter with version 6
6.0 Yes (6.0) Yes (6.0)
It was quite buggy -- a very telling fact that you have version 6, is when you go to Data > New Dataprovider in a blank document and you only have one (non-functional) radio button.
Later on, version 6.5 was introduced -- it was much more stable
6.5 Yes (6.5) Yes (6.5)
This version, to me, is still the reason why so many people use BusinessObjects. It's stable -- both the WebI version and the DeskI version are rock-solid.
Then, Business Objects, the French company, bought Crystal Reports. Some time later, they brought out version XI. It was a new WebI and many people were confused, since it didn't include a DeskI of BusinessObjects.
XI No Yes (XI)
Of course, this could not remain for long, and some time later, they brought out version XI R2
XIR2 Yes(XI R2) Yes (XI R2)
In fact, from this time forward, we started talking about Desktop Intelligence.
XI R2 was a bit limited -- linking dataproviders didn't work, ranking didn't work yet.. so, no surprise, soon thereafter we had XI R3
Version DeskI WebI Rich Client
XIR3 Yes(XI R3) Yes (XI R3) Yes (XI R3)
It still included a DeskI version, but from this point onwards, new features were included in WebI and not in DeskI. Point and fact : Tracking. WebI came with a feature that allowed you to see if a piece of data had changed since last refresh. So, anything in red had descended, anything green had increased and anything with a line across it had vanished.
XIR4 No Yes(XI R4)
And now, since December 2010, we have BI4 as Business Objects XI R4 is referred to. It no longer includes Desktop Intelligence although there is a plug-in that exists, to allow DeskI XI R3 reports to be published onto Webi XI R4.
Cheers
Peter
The two most recent items (Business Objects)
This is going to be an easy one. Just a tip.
Let's assume, you want to know information for the two most recent pieces of data. Issue is, how do you get those most recent ones.
First, you need a measure -- based on a date.
Year([your_date]) this will get you the year, which is more than unique enough.
+Monthnumberinyear([your_date])/12
to the year, we add 1/12 of our month.
+daynumberinmonth([your_date])/31
and to that, we add 1/31 of the day.
The thing is, we don't want
15/March/2012
to be bigger than
1/April/2012
if we divide, we end up with numbers that stay in proportion.
An alternative, and probably an even better way to do this, is to multiply:
(Year([your_date])*10000) + 'that gives us 20120000
(Monthnumberinyear([your_date]) * 100)+ ' that gives us 201212
daynumberinmonth([your_date]) ' that should make 20121224
Interesting, it keeps the date readable. Which is always useful.
So, now we have our measure to base our ranking on -- now it's easy to get the two most recent ones isn't it.
Cheers.
Peter
Abonneren op:
Posts (Atom)