At the end of the year, you need to attain the cumulated total of the monthly objectives.
So, every month, you would like to know, how well you did, so far, compared to the objectives of every month so far, and the total objective for the entire year.
Sounds like a mouthful -- believe me, it is. But it's fun -- you'll see.
The function we'll be using is : RunningSum()
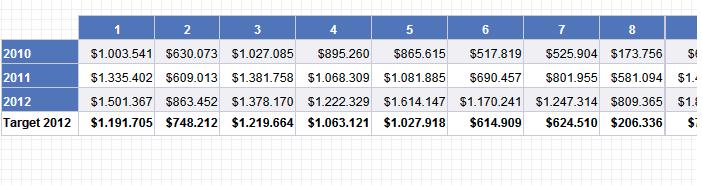
Here's the table I'm starting with :
The formula to do this is :
=(sum([Sales revenue]) where([Year] = "2012") /sum([Sales revenue]) where([Year] = "2011"))*100
(you could leave the *100 away and format the number as a percentage.. works just as fine)

There, that part is done. Now, we calculate the variance compared to the Target. That shouldn't be too difficult, since the formula is basically the same as the previous operation :
=(sum([Sales revenue]) where([Year] = "2012") /[Target 2012])*100

Perfect.Next, the cumulative Index compared to the target.
The formula is almost the same :
=(Runningsum([Sales revenue]where([Year] = "2012") ) /Runningsum([Target 2012]))*100
the MAJOR difference, is that you need to put the Where inside the brackets of the runningsum.

And, we have our cumulative total. Looking good. Last but not least, we could leave that first cel of our Cumulative variance empty, since it's the same as the line above.. so we elaborate our formula a little
=If ([Month]>1) Then ((CumulatieveSom([Sales revenue] Where([Year] = "2012")) / RunningSum([Target 2012])) * 100)
Lovely isn't it :)
Enjoy !
Peter
Geen opmerkingen:
Een reactie posten