With the implementation of BI4, our company moved from producing .xls files to .xlsx files. All good and well, but that brings some unexpected consequences as well.
Every day, we produce some 80 reports, that get stored on a SharePoint Server. Every file has some custom properties in SharePoint, like a periodicity and a Group.
With .XLS files, this metadata gets stored on one place only : SharePoint. However, when you work with .XLSX files, you may run into some trouble -- because the Metadata is then stored INSIDE the document. Given the fact that some of the properties are custom, there is no way to update the metadata, until you have actually uploaded the document to SharePoint -- and if that file came from Business Objects, you just overwrote your Metadata with BLANKS.
This article will provide you with a work-around.
=========================
First some VBScript code:
Set oBook = oExcel.Workbooks.Open(objFile)
oBook.saveas strDestFolder & Replace(objFile.Name, "$", "\"), 51
oBook.ContentTypeProperties("Group").Value = sGroup
oBook.ContentTypeProperties("Period").Value = sPeriod
oBook.ContentTypeProperties("Description").Value = sDescription
oExcel.AutomationSecurity = 1
oBook.save
oBook.close
oExcel.quit
Before you implement this, you will be needing to write a script that will copy your Excel documents to SharePoint. If you need help with that part, probably the above code will do you little good.
It took me a good deal of time, to write the code above -- very happy with it. What I'm doing in the rest of the script is run through a text-file to locate the file I'm copying --and I store the current description and group in it.
The script above will then store that onto the SharePoint server, after saving the file to that location.
For you Powershell lovers:
$objFile = $objExcel.workbooks.open($OutFile)
$builtinProperties = $objFile.ContentTypeProperties
foreach($builtinProperty in $builtinProperties){
if ($builtinProperty.Name -eq "Description"){
$builtinProperty.value = $Description
}
if ($builtinProperty.Name -eq "Period"){
$builtinProperty.value = $Period
}
if ($builtinProperty.Name -eq "Group"){
if($group[1] -eq "B00"){
$builtinProperty.value = "Bank"
}
}
}
$objFile.Save()
I have no good PowerShell editor, so the above code took me even longer to put together.. it does the same as the vbscript.
So the workaround is basically : use VBScript to copy your Excel file to SharePoint. Open it with VBScript, read the metadata from a textfile.. and then, using the code above, to set the metadata.
I hope it helps you -- I'm pretty sure it will help me, if I ever need to figure this out again.
Peter
Posts tonen met het label SharePoint. Alle posts tonen
Posts tonen met het label SharePoint. Alle posts tonen
donderdag, juli 14, 2016

woensdag, december 14, 2011
Creating a KPI in PerformancePoint
So far, it’s been a love/hate relationship with SharePoint, but a tool like PerformancePoint does get my full attention. So far, I had some trouble getting it to do what I want, so, here I share what I found so far.
1) Deploying a demo-cube
Once I had downloaded the AdventureWorks2008 database, I found a great procedure right here:
http://techpunch.wordpress.com/2008/09/08/sql-server-2008-how-to-build-and-deploy-adventureworks-olap-cubes/
2) Creating the connection:
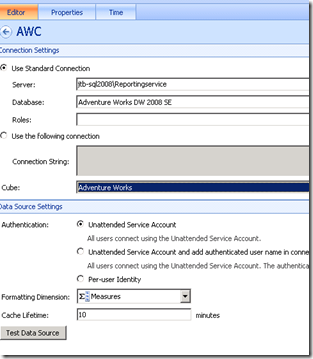
I provided the server and instance name. Note the backslash to enter the instance name. Not a forwardslash, which was one of the errors I made.
Secondly, I selected the Database and Cube.
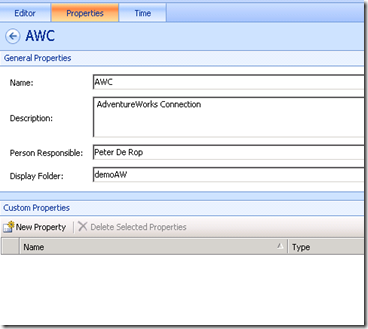
Next, on the properties tab, I provided a name:
And last but not least, the Time-tab. So far, it eluded me somewhat.
To get this to work, you need a time-hierarchy in your OLAP cube. Fortunately, the AdventureWorks database has one, in case you want to try it out.
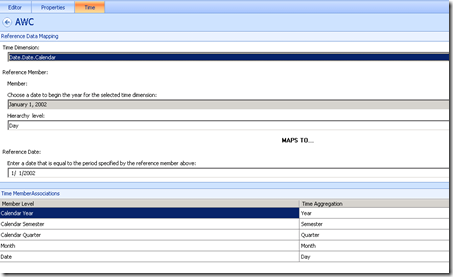
For the Time Dimension, I chose to use Date.Date.Calendar, which points to a time-hierarchy in the AdventureWorks OLAP cube. Secondly, I browsed to a child item I wanted to use as a reference. In this case, I took January,1,2002. And I defined the level to be Day, because the above selection is in fact a day.
Underneath, you then have to choose from a calendar, to what date this particular item maps. I guess Performance Point is trying to work out what format the date is in and I’ve seen more intuitive interfaces to accomplish this.
Below that, you now have the chance to tell Performance Point, which item in your OLAP cube maps to the Year, the Semester, the Quarter the Month, the Day, the hour and the minutes if you have them.
There, that’s the tricky part.
3) Creating the KPI
First, you choose, which measure in your database contains the number you want to show. In my case, that’s going to be the Sales Amount measure. (note the button at the bottom: “Change Source”) Took me a while to locate that one
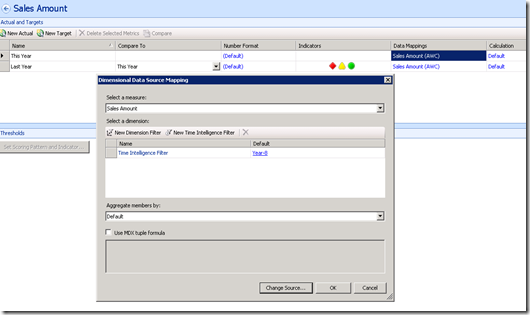
For the filter, I created a Time Inteligence filter. And I entered Year-8 This will return data for the current year,-8 years. My first mistake was to enter Year-1 because I thought the date I had chosen at the datasource, would be used as a reference, not true. It takes the current date.
So, Year-8 it is.
I then did the same for the target. By the way, I renamed them to be This year and last year.
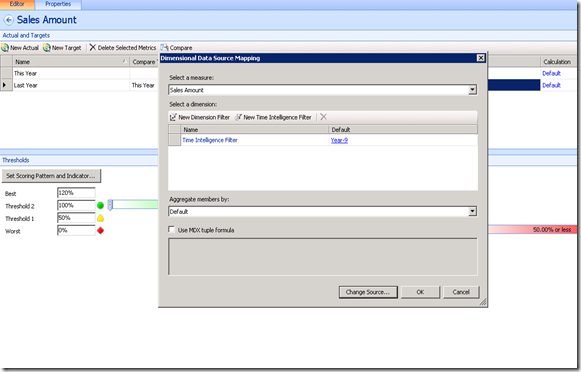
And I entered Year-9 for that one. This way, I could compare 2003 to 2002 figures.
After clicking OK, I then proceeded to make a scorecard:
I just dragged the KPI (from the right pane) into the Scorecard and disco :
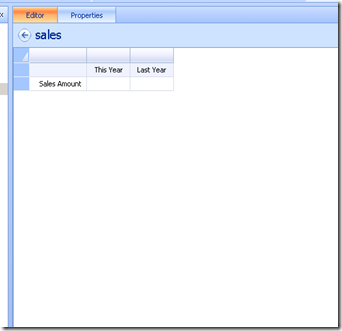
No numbers, but lo and behold, when you press save or ctrl-s, they do emerge:
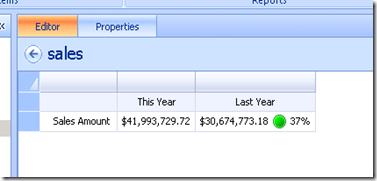
Our KPI tells us we did 37% better than last year. Cool.
Last step, we could add the quarter by dragging it again from the right pane:
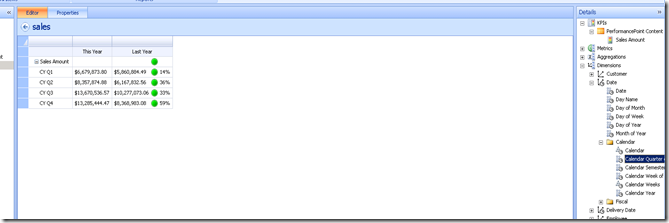
Nice
More to come
Binabik
1) Deploying a demo-cube
Once I had downloaded the AdventureWorks2008 database, I found a great procedure right here:
http://techpunch.wordpress.com/2008/09/08/sql-server-2008-how-to-build-and-deploy-adventureworks-olap-cubes/
2) Creating the connection:

I provided the server and instance name. Note the backslash to enter the instance name. Not a forwardslash, which was one of the errors I made.
Secondly, I selected the Database and Cube.
Next, on the properties tab, I provided a name:

And last but not least, the Time-tab. So far, it eluded me somewhat.
To get this to work, you need a time-hierarchy in your OLAP cube. Fortunately, the AdventureWorks database has one, in case you want to try it out.

For the Time Dimension, I chose to use Date.Date.Calendar, which points to a time-hierarchy in the AdventureWorks OLAP cube. Secondly, I browsed to a child item I wanted to use as a reference. In this case, I took January,1,2002. And I defined the level to be Day, because the above selection is in fact a day.
Underneath, you then have to choose from a calendar, to what date this particular item maps. I guess Performance Point is trying to work out what format the date is in and I’ve seen more intuitive interfaces to accomplish this.
Below that, you now have the chance to tell Performance Point, which item in your OLAP cube maps to the Year, the Semester, the Quarter the Month, the Day, the hour and the minutes if you have them.
There, that’s the tricky part.
3) Creating the KPI
First, you choose, which measure in your database contains the number you want to show. In my case, that’s going to be the Sales Amount measure. (note the button at the bottom: “Change Source”) Took me a while to locate that one

For the filter, I created a Time Inteligence filter. And I entered Year-8 This will return data for the current year,-8 years. My first mistake was to enter Year-1 because I thought the date I had chosen at the datasource, would be used as a reference, not true. It takes the current date.
So, Year-8 it is.
I then did the same for the target. By the way, I renamed them to be This year and last year.

And I entered Year-9 for that one. This way, I could compare 2003 to 2002 figures.
After clicking OK, I then proceeded to make a scorecard:
I just dragged the KPI (from the right pane) into the Scorecard and disco :

No numbers, but lo and behold, when you press save or ctrl-s, they do emerge:

Our KPI tells us we did 37% better than last year. Cool.
Last step, we could add the quarter by dragging it again from the right pane:

Nice
More to come
Binabik
Abonneren op:
Posts (Atom)